
Research
Dashboards
Power BI, Looker Studio and Plotly. The reporting that ships inside a Portal tenant, built to hold up at enterprise scale.
Explore the galleryGallery
Ten dashboards and visualizations. The linked ones open the live report.
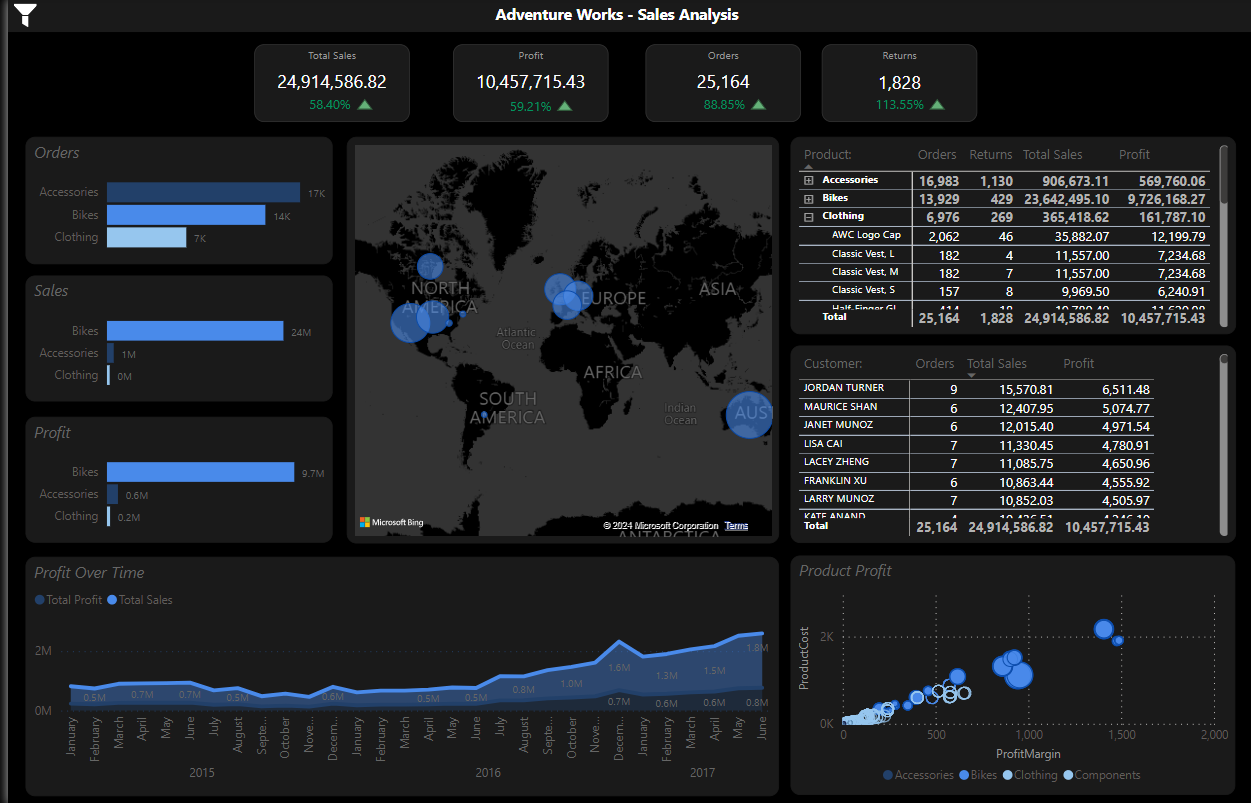
Adventure Works
Interactive dashboard showing sales performance across regions with detailed breakdowns by product category, sales representative, and time period. Actionable insight for sales managers looking for trends and opportunities.
Open the live report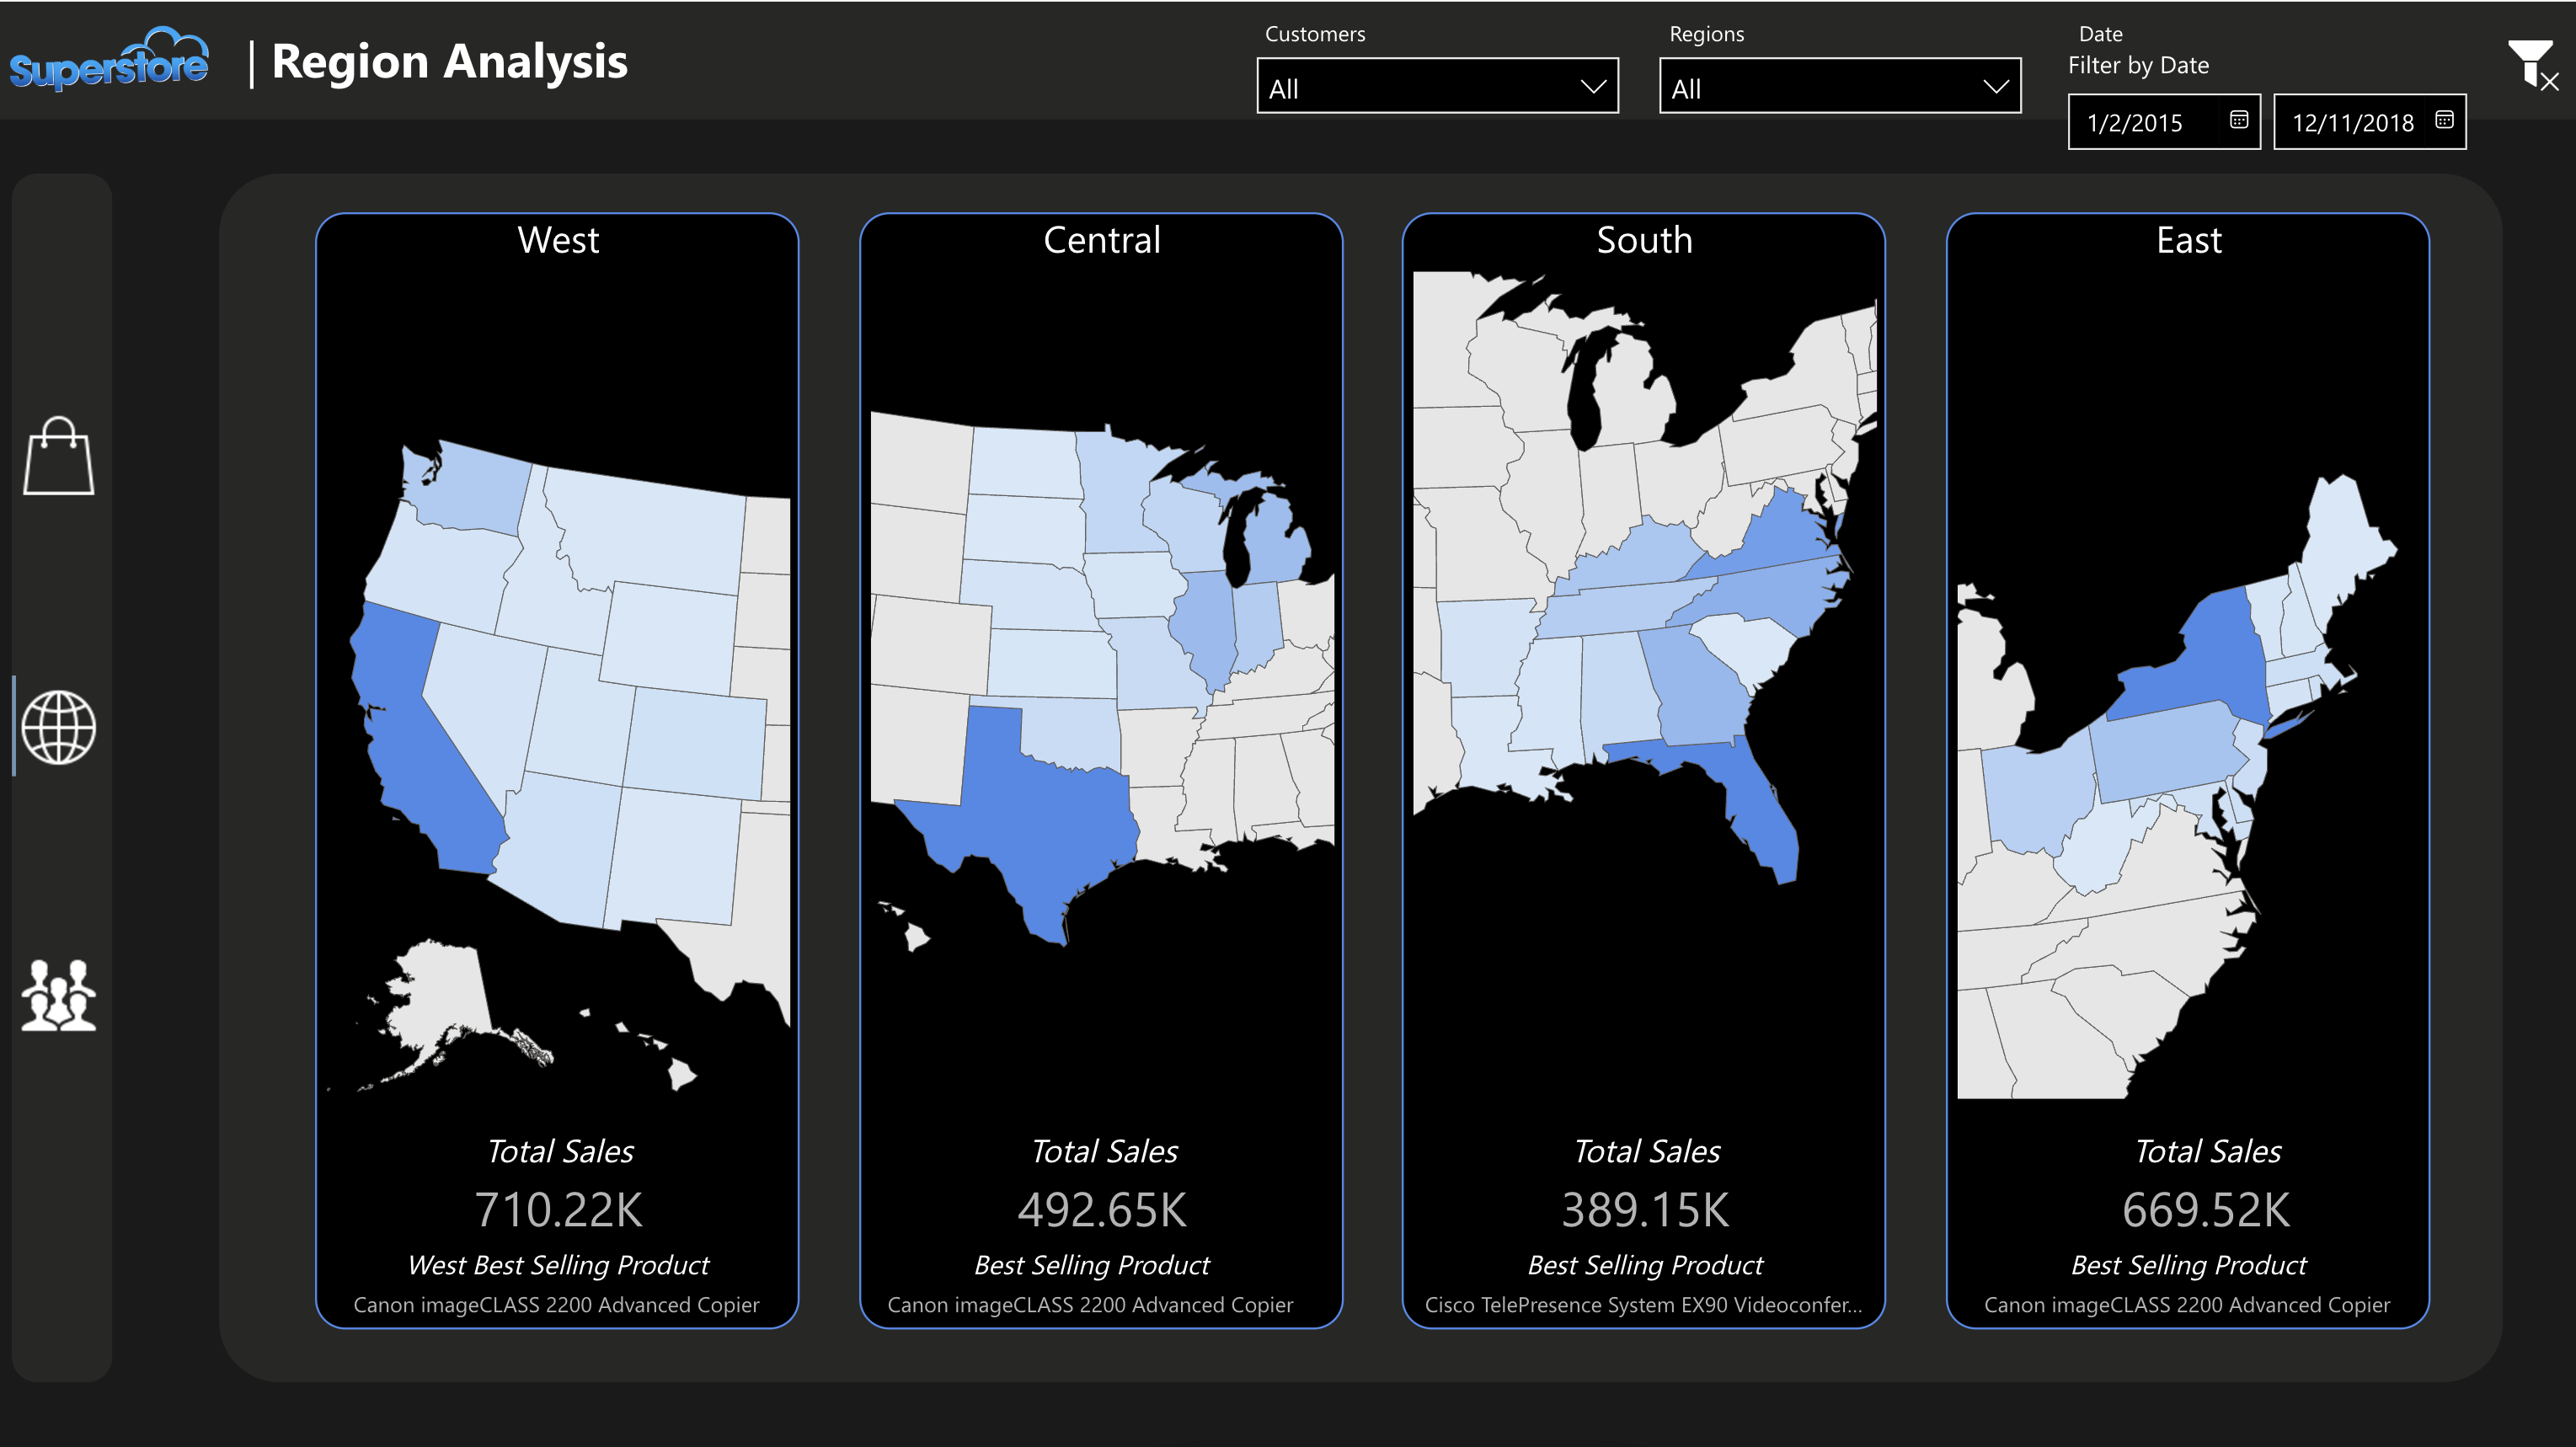
Superstore Analysis
Comprehensive analysis of sales, profits, and customer behavior for Superstore retail data, with insight into regional performance and product categories.
Open the live report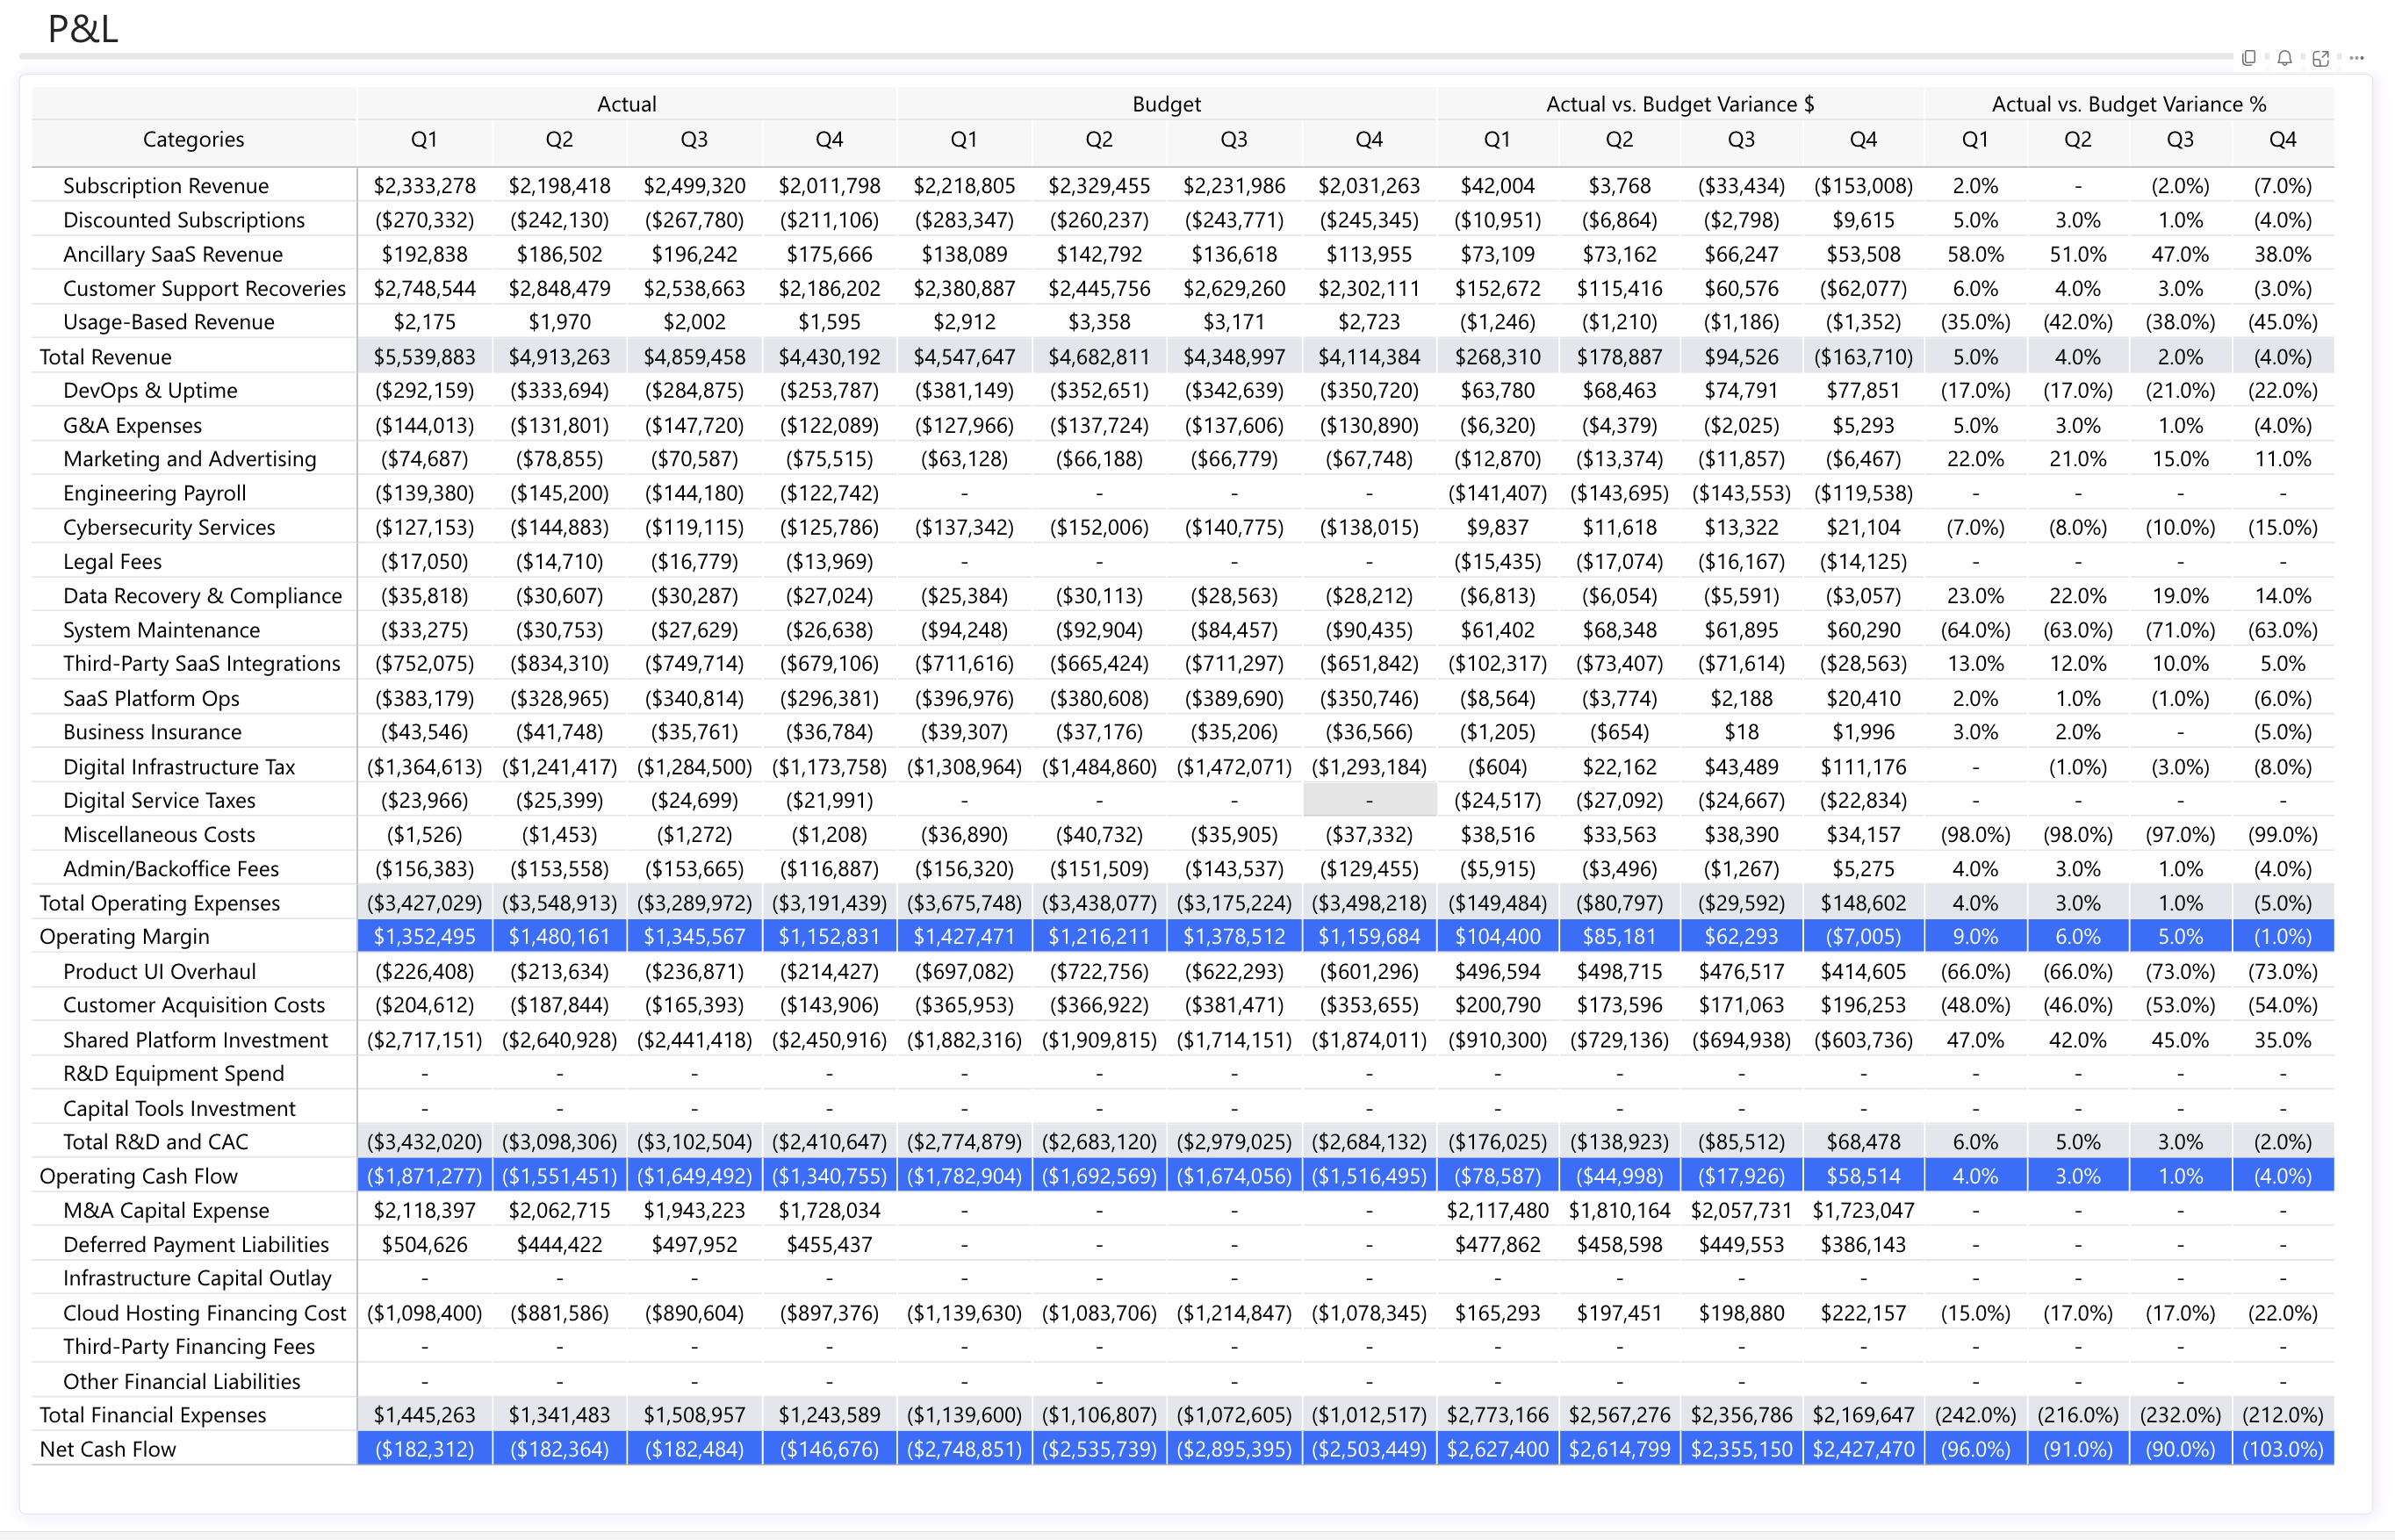
Automated Profit and Loss Statement
Automated P&L dashboard with real-time financial insight, revenue breakdowns, expense tracking, and profitability analysis. Executives monitor performance, find cost savings, and decide on the numbers.
Open the live report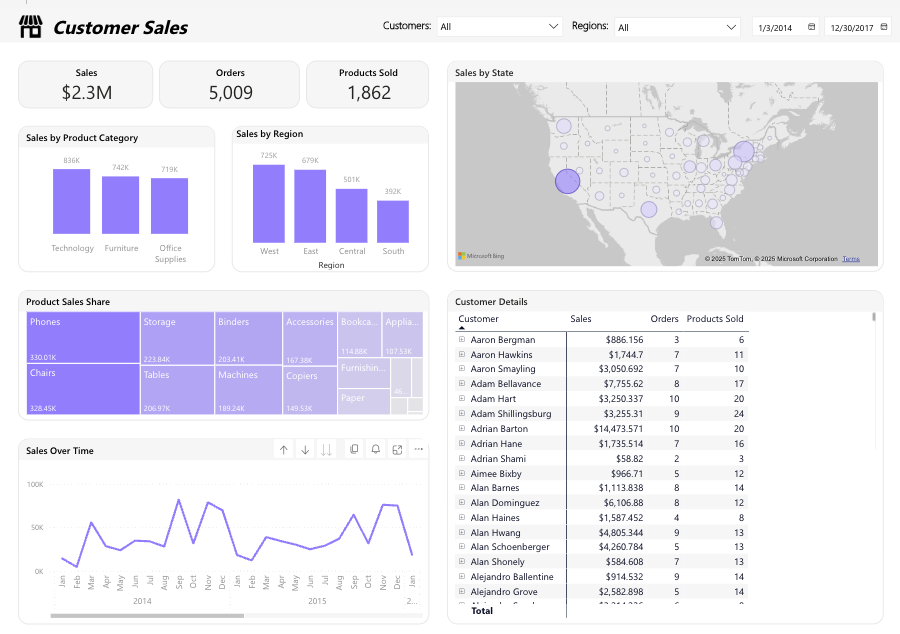
Customer Sales Report
Customer sales analytics with performance, order tracking, product insight, and regional analysis. Customer breakdowns, sales trends over time, and the geography behind them.
Open the live report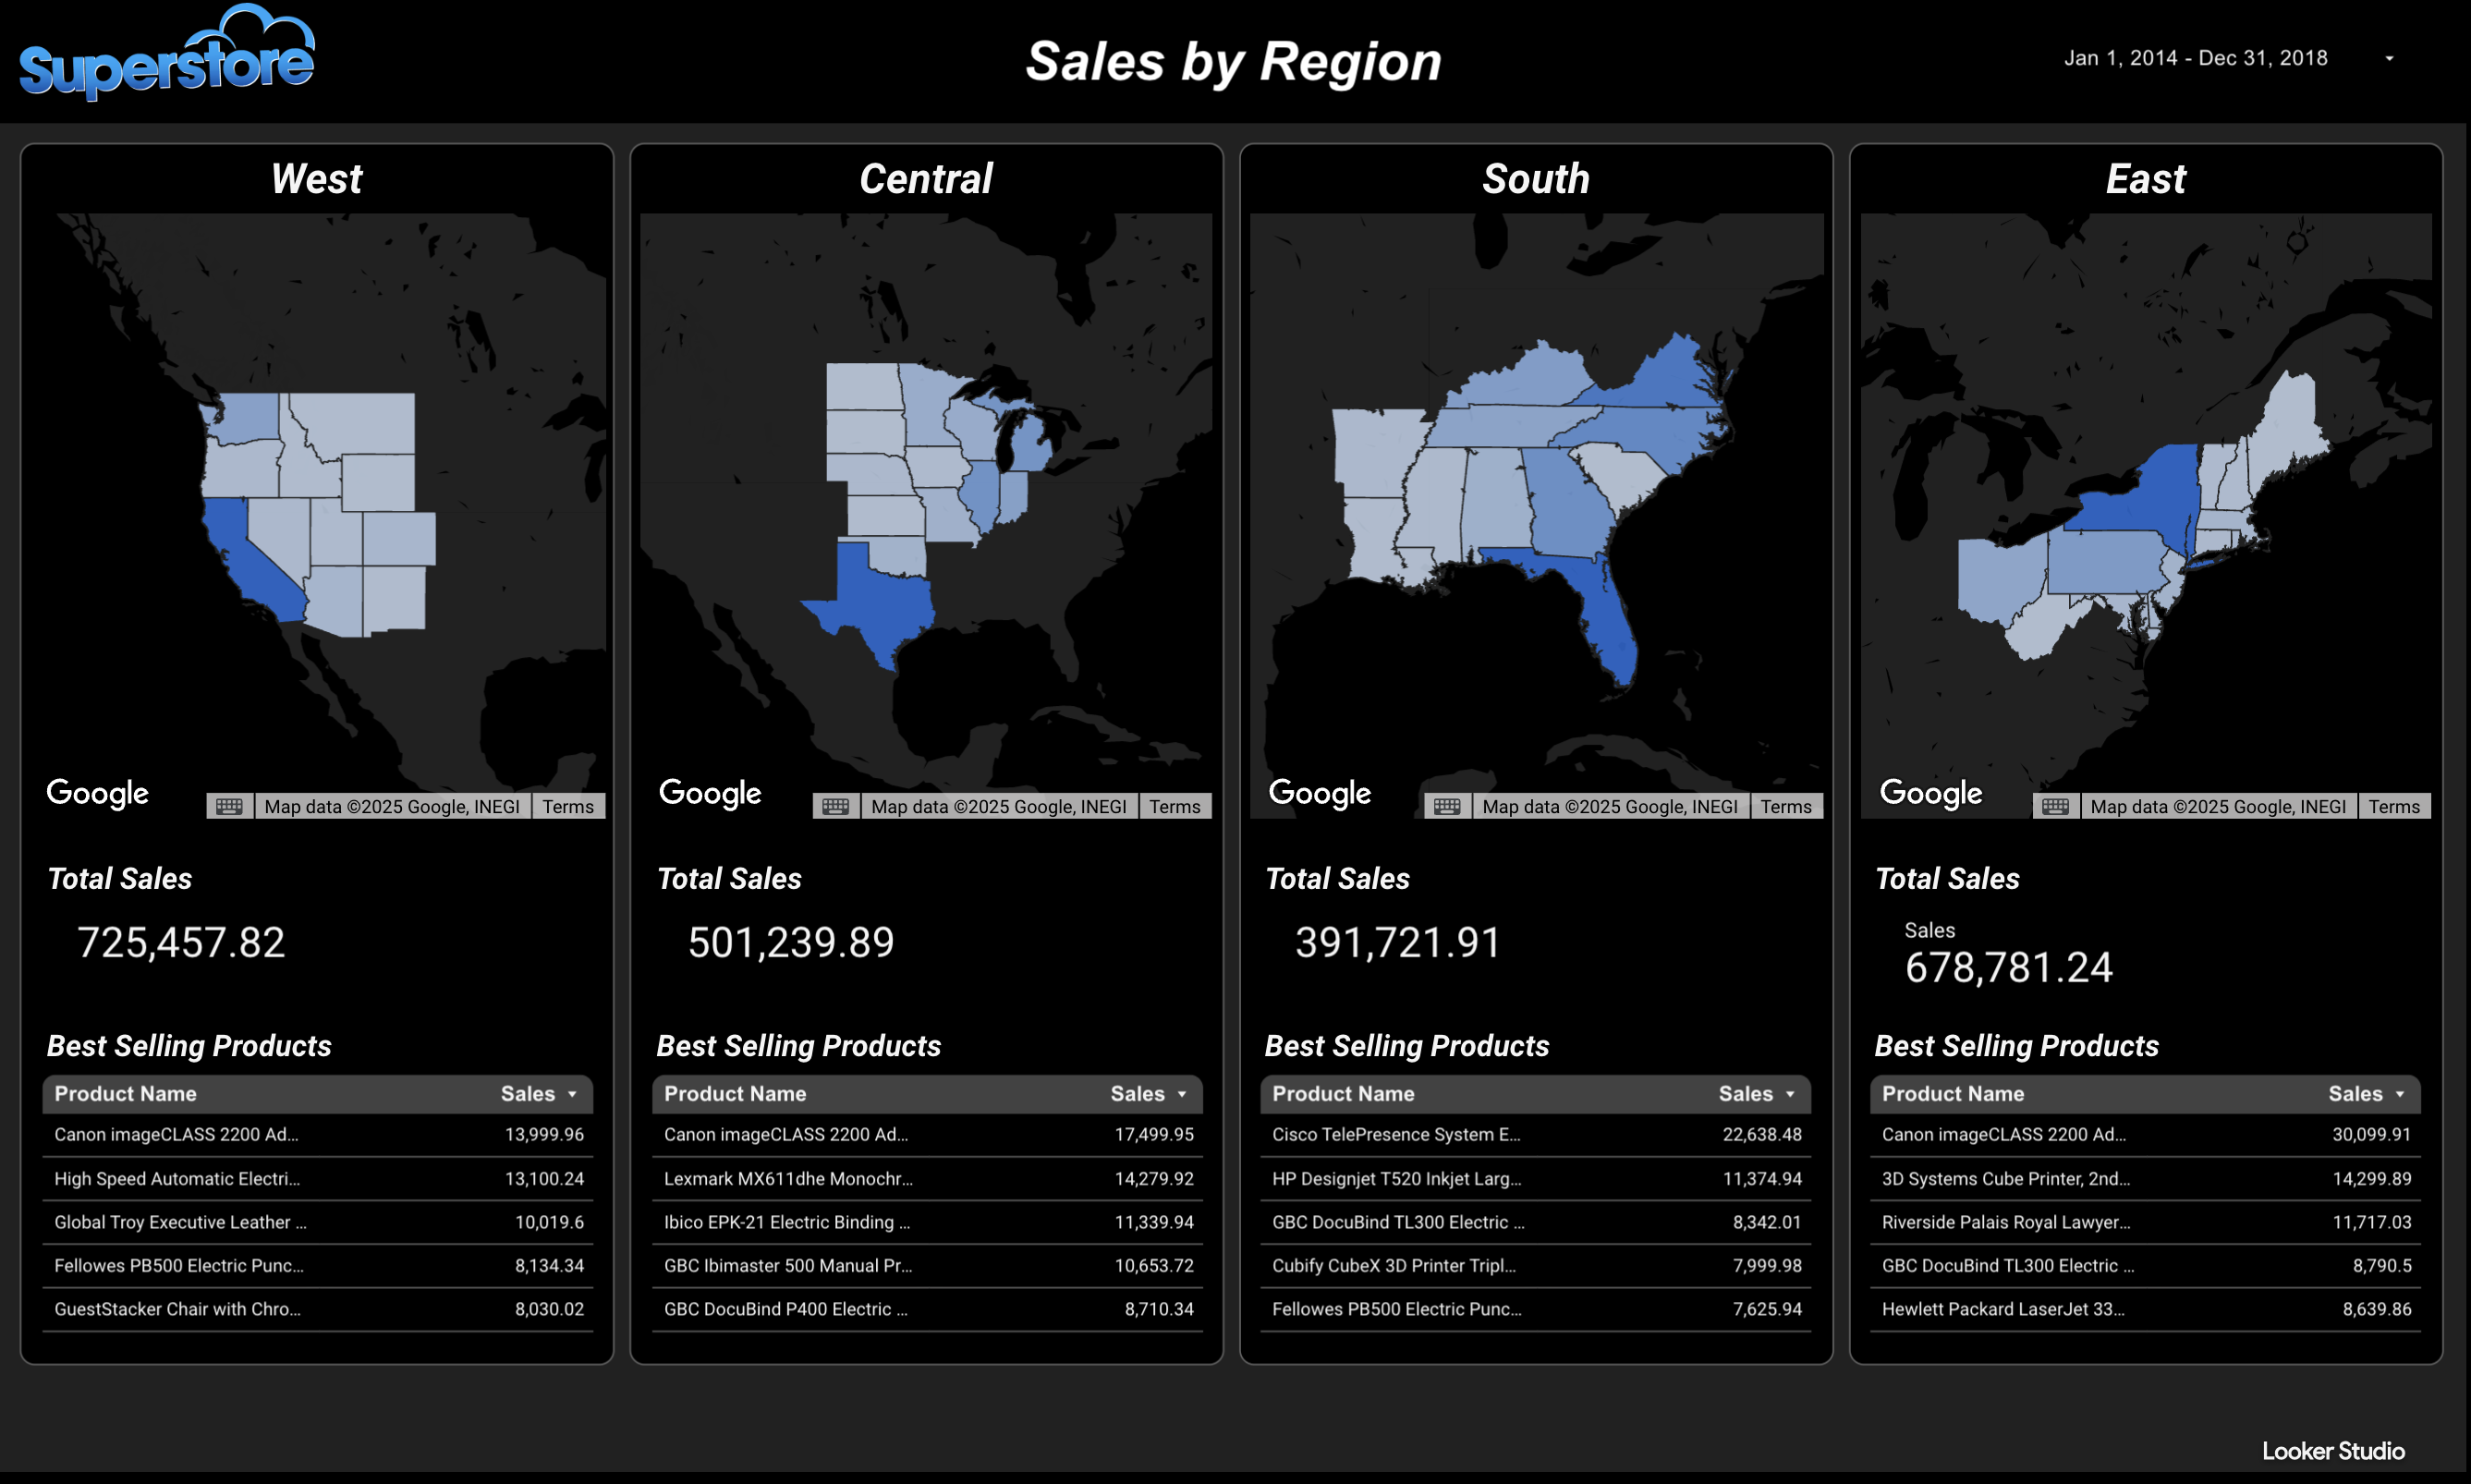
Superstore Dashboard
Looker Studio dashboard over Superstore retail data with dynamic filtering, sales trends, and regional performance.
Open the live report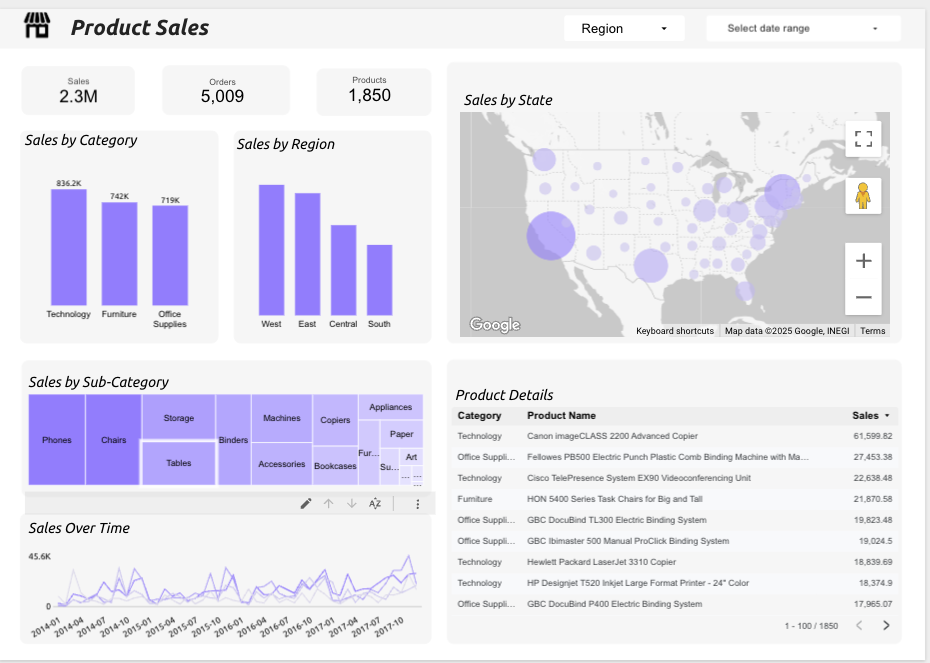
Product Sales Report
Looker Studio dashboard analyzing product sales performance across categories and time periods, with comparisons and performance tracking.
Open the live report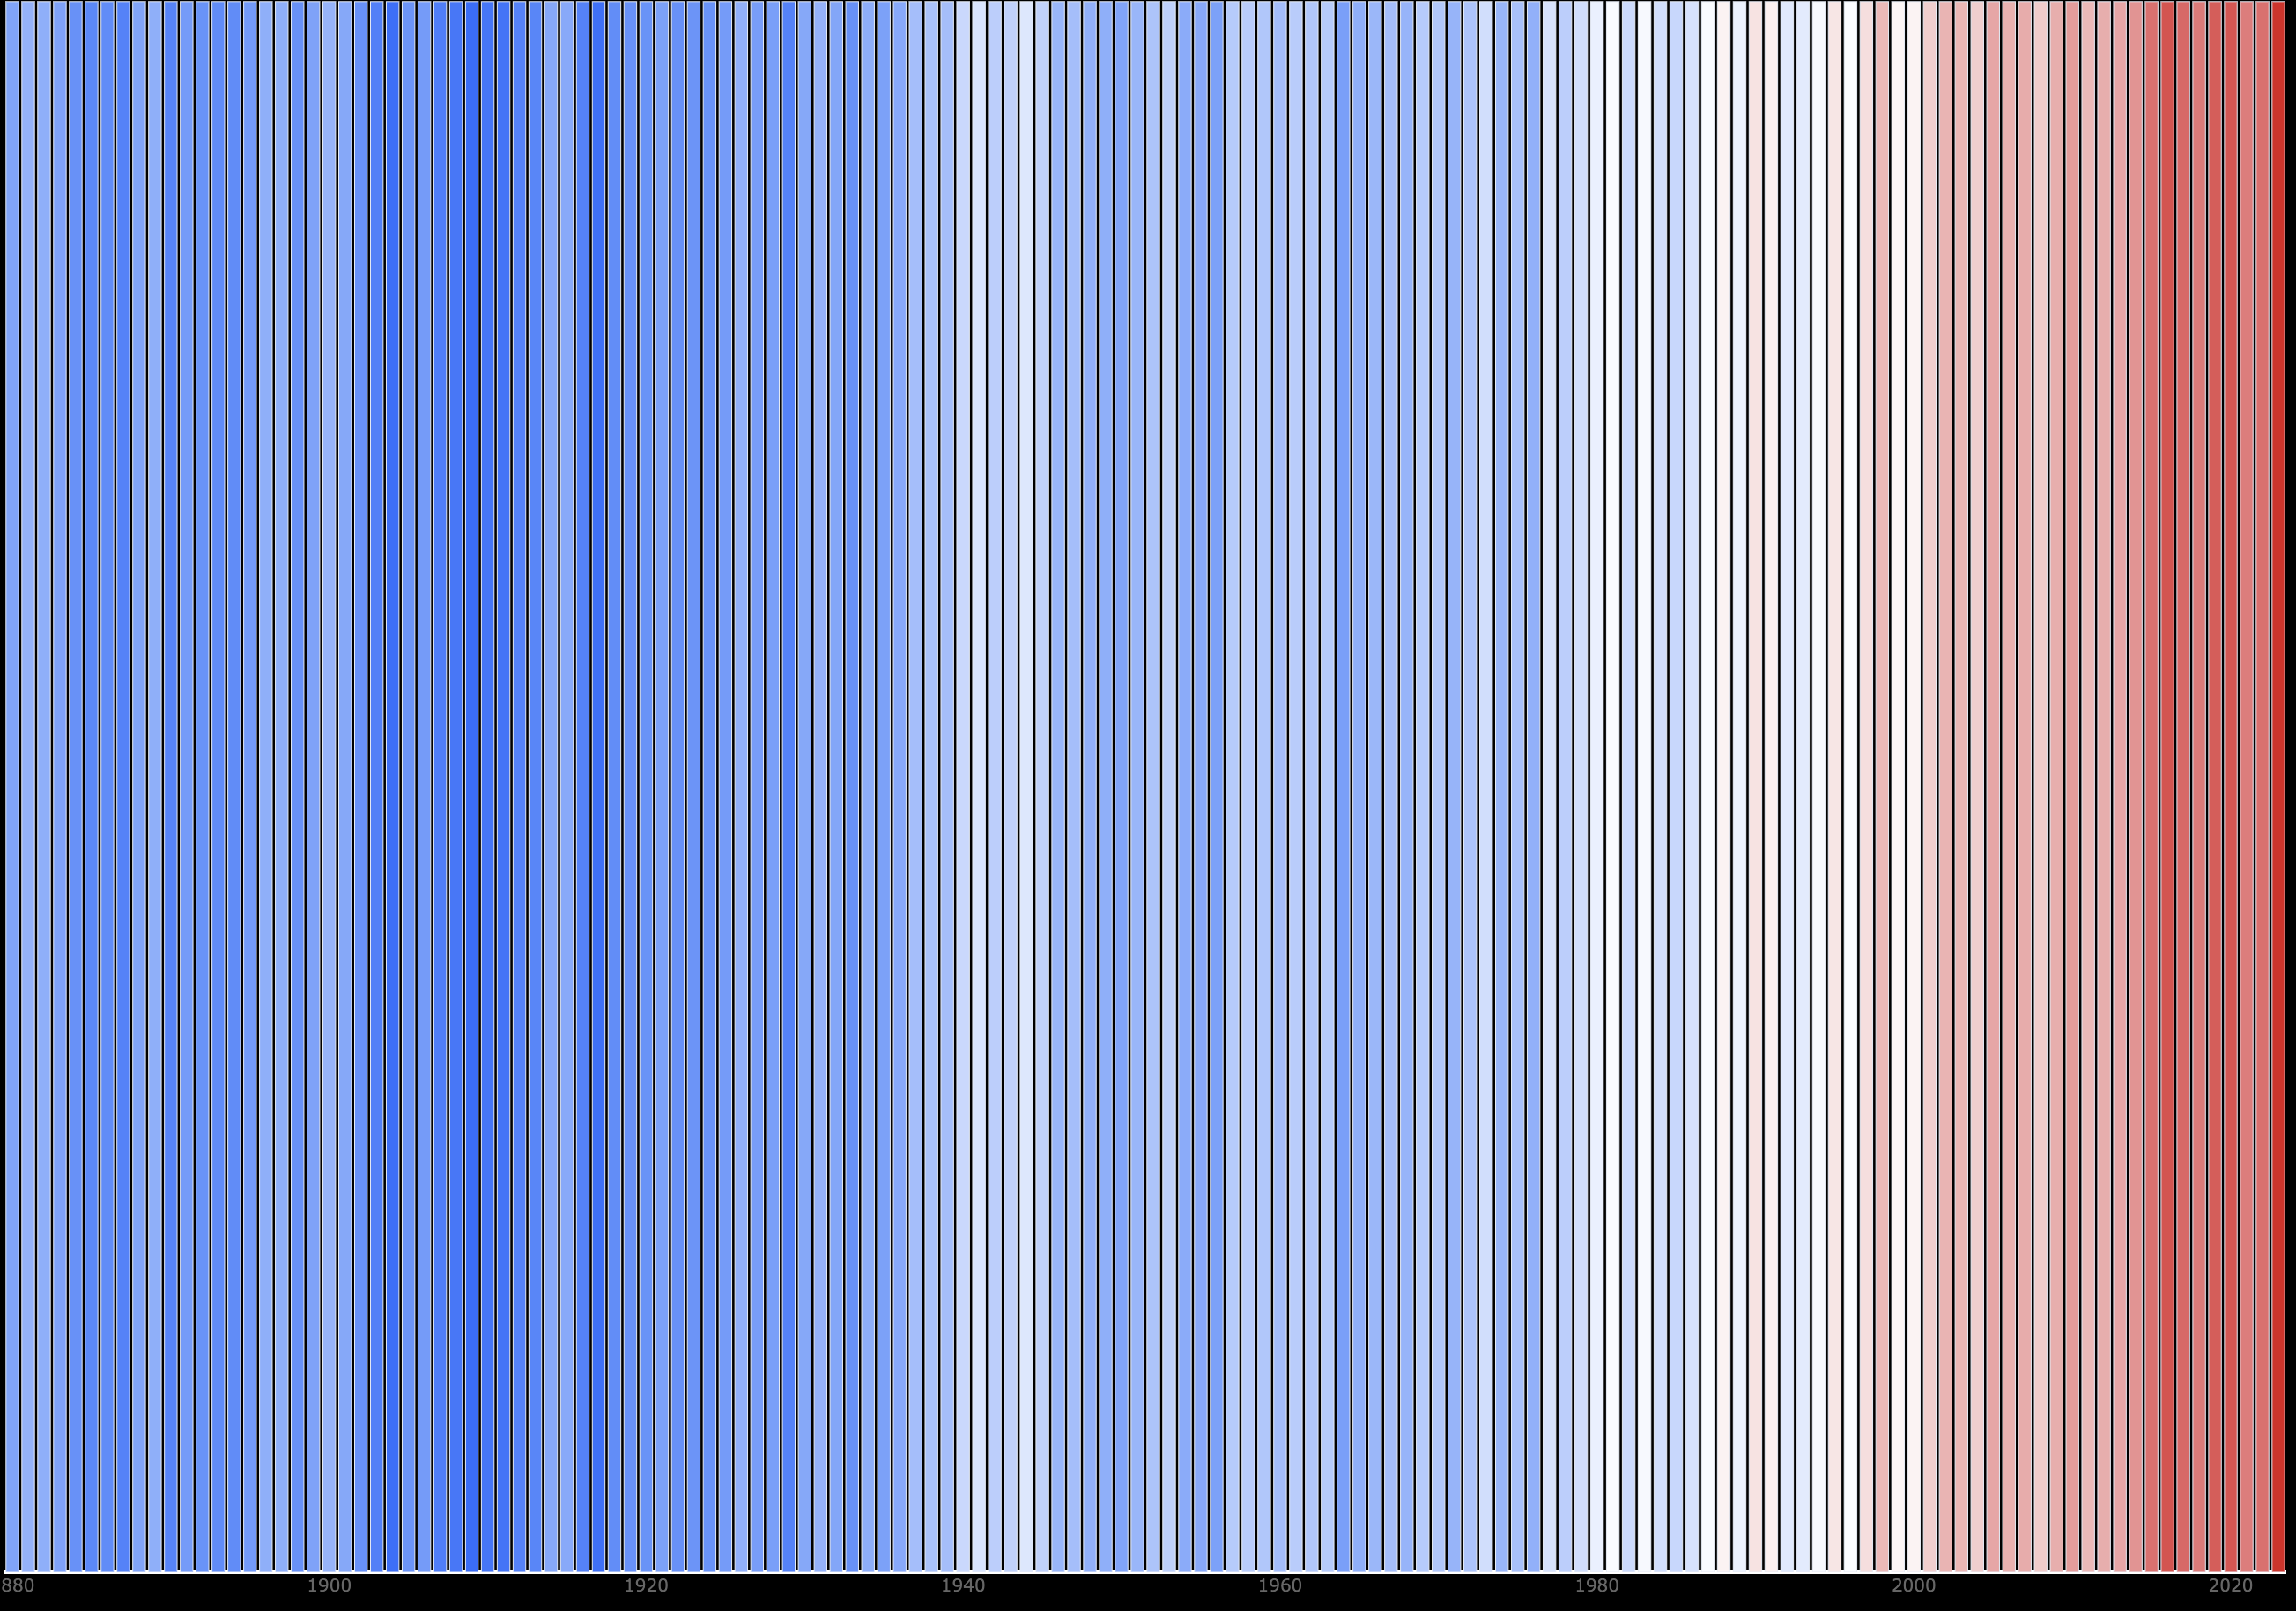
Earth's Warming Stripes
Climate data visualization showing global temperature anomalies as warming stripes, with colour-coded bands for deviation from the historical average.
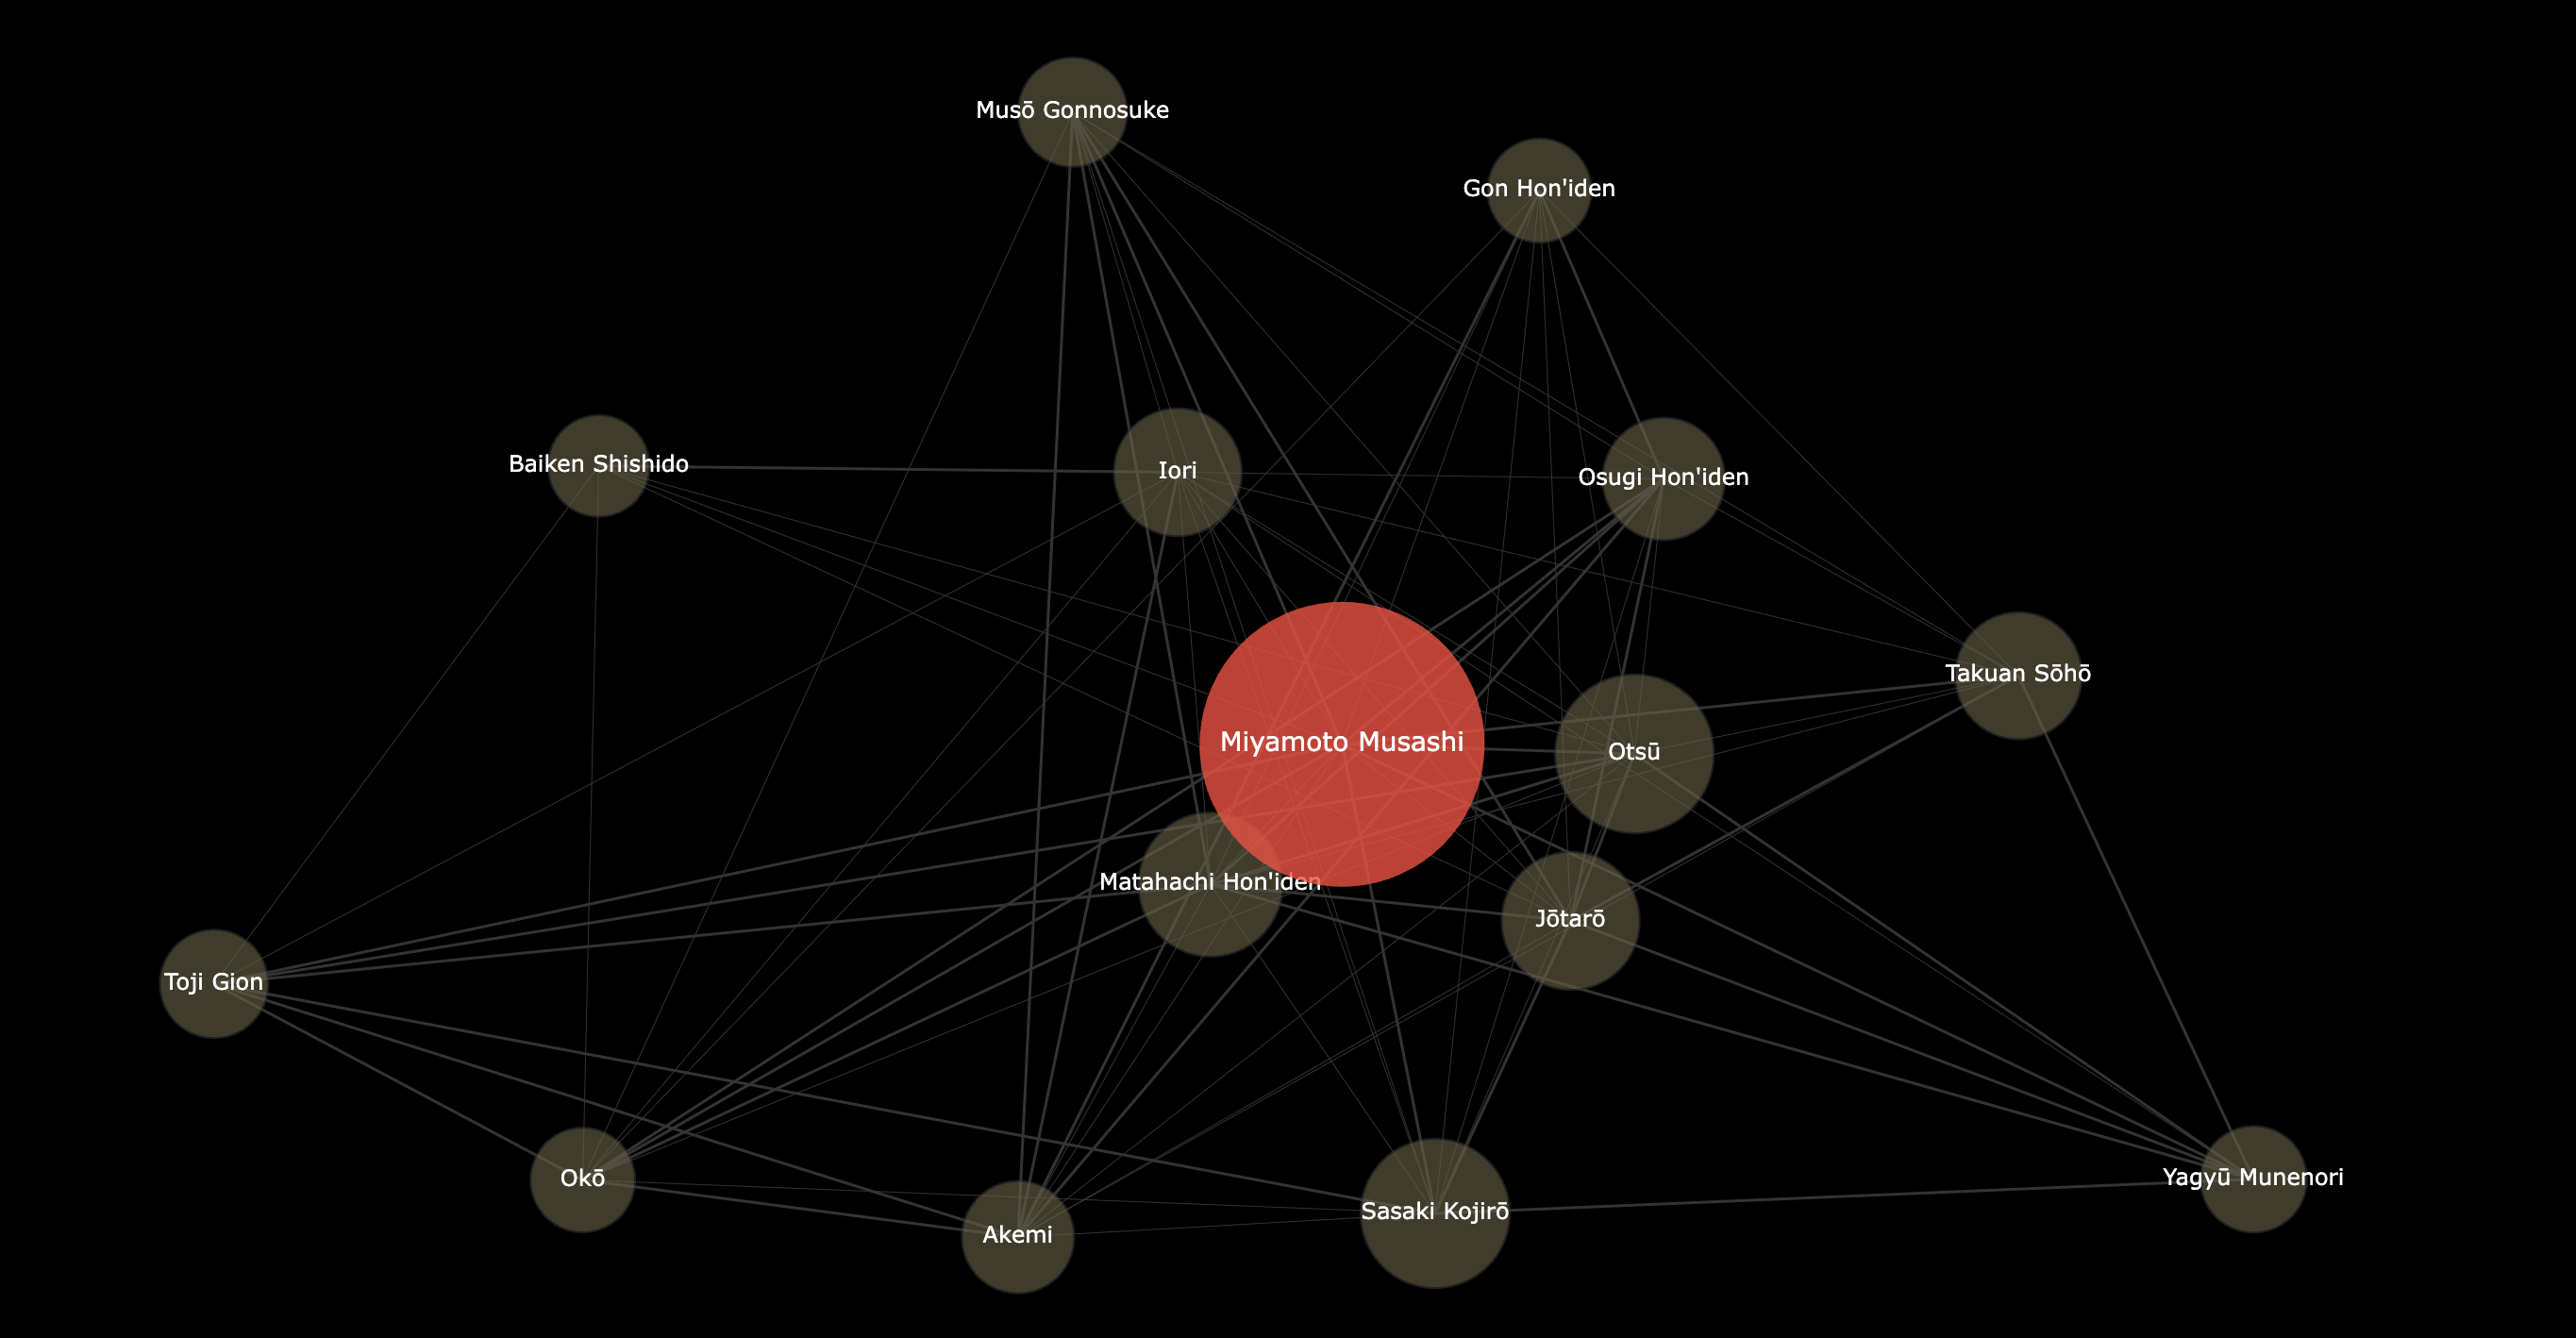
Musashi Character Map
Character relationship visualization from the Musashi novel: a network graph of the connections between the characters.

Spotify Discography Evolution
Visualization tracking an artist's discography over time, showing how style and popularity move across a career.
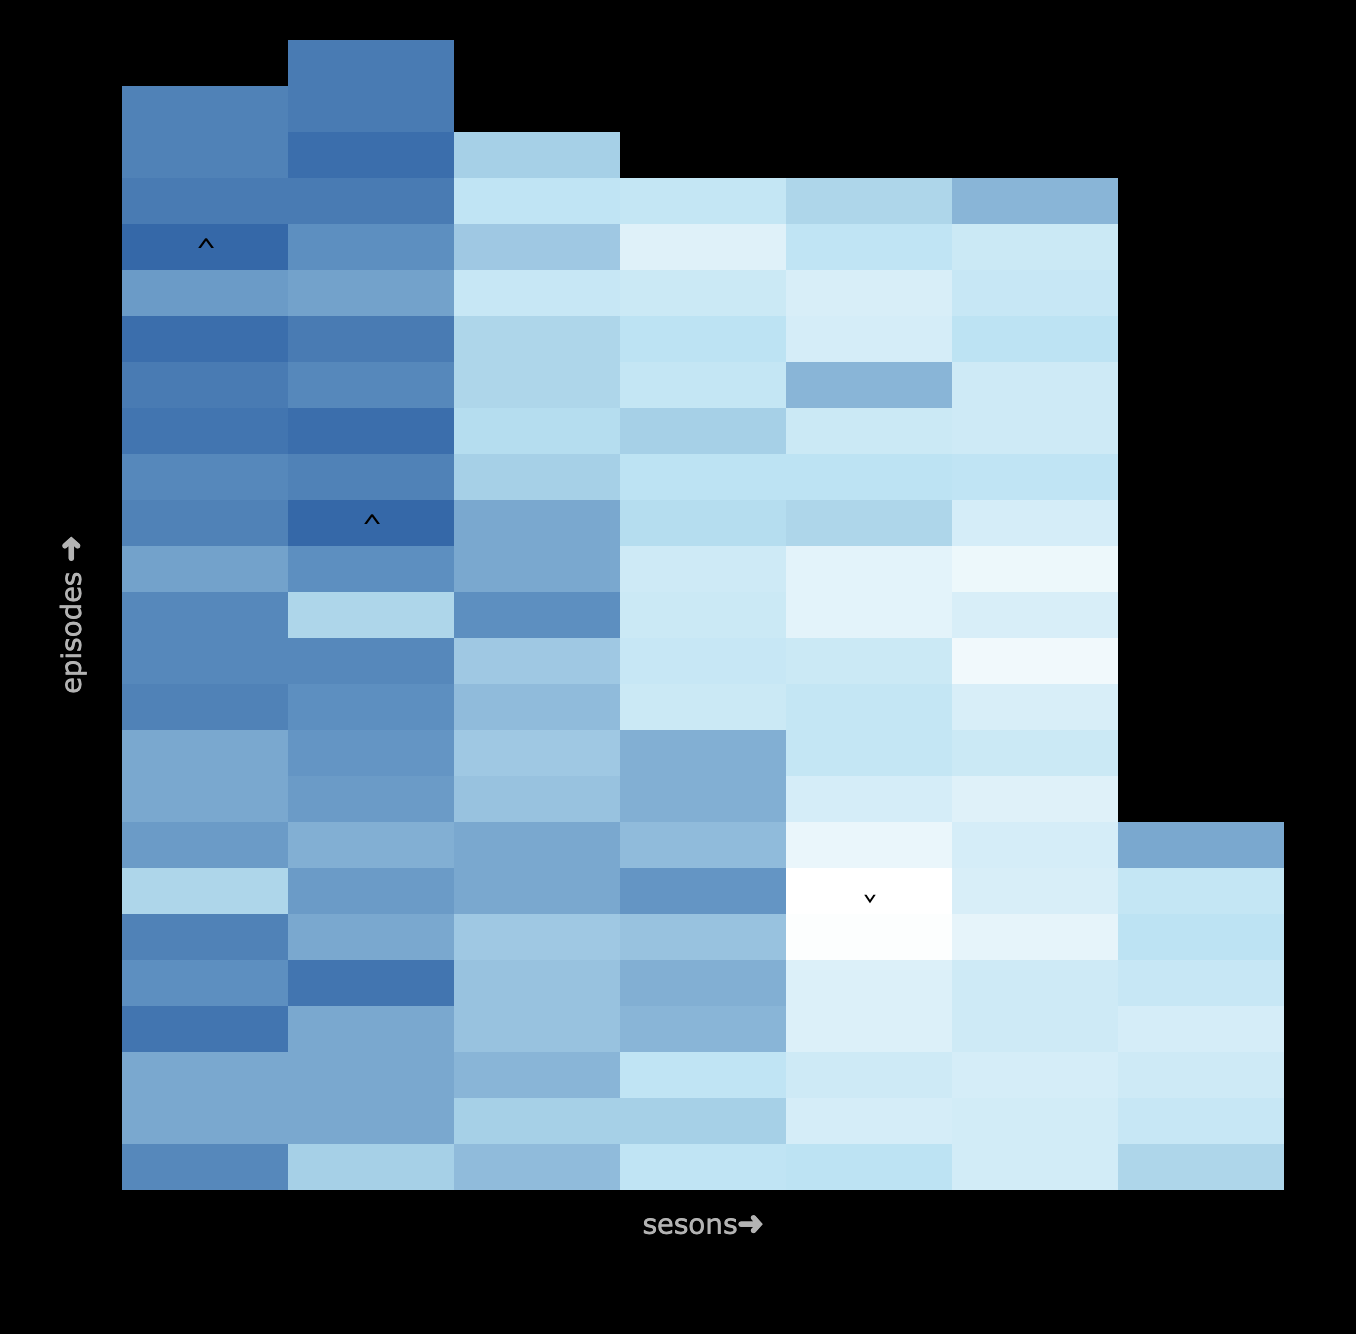
TV Show Heat Map
Heat map of TV show ratings across seasons and episodes, showing where a series holds its audience and where it loses it.